How to Run a 2-Sample T Test in Minitab
When working with data sets in six sigma projects, often there will be a need to compare two groups to each other. A 2-sample T test in Minitab is a hypothesis test to study whether there is a statistically significant difference between the means of two populations. The 2-sample T test runs a comparison of two categories within the same categorical variable, which becomes valuable when trying to answer questions that involve understanding the effects of the addition of a program or change to a sample of subjects.
How to Run a 2-Sample t Test in Minitab
In this example, we will be using a 2-Sample t data file for Minitab. Clicking the previous link will download the file for your use. Once you have the file open in Minitab we will be comparing the price of gasoline between State A and State B. We will use a data set assuming that each data set is normally distributed with equal variances. The hypothesis will be:
Null Hypothesis (H0): μ1 = μ2
Alternative Hypothesis (Ha): μ1 ≠ μ2
Where μ1 is the mean of one population and μ2 is the mean of the other population of our interest.
Step 1: Click Stat → Basic Statistics → 2-Sample t.

A new window named “Two-Sample t for the Mean” pops up.
Step 2: Click in the blank box next to “Samples” and the “Gas Price” appears in the list box on the left.
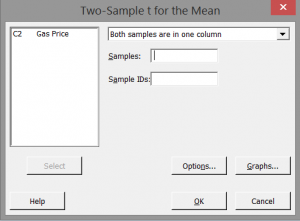
Select “Gas Price” as the “Samples.”
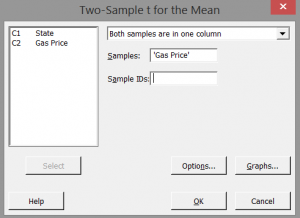
Step 3: Click in the blank box next to “Sample IDs” and the “State” appears in the list box on the left.
Select “State” as the “Sample IDs.”
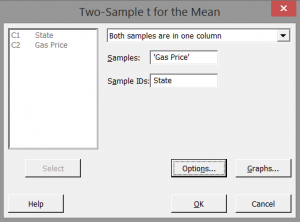
Step 4: Click options.
Check the box that says “Assume Equal Variances”
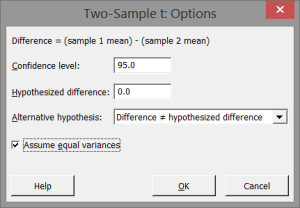
Click “OK” to save, and click “OK” again to run the test.
Results of our 2-Sample t Test in Minitab:
The study resutls of how to run a 2-sample t test in Minitab (when σ1 = σ2) appear automatically in the session window after clicking “OK.” Minitab's output is below. Take notice of a couple of important bits of information provided by the output. The mean of state A and state B, the number of data points for each state represented by 'N' as well as each standard deviation.
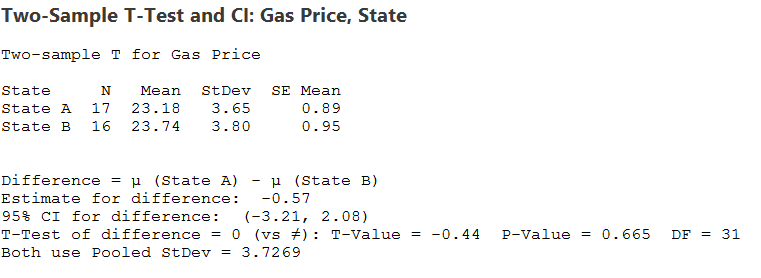
The key statistical output provided by Minitab when running a 2-sample t test is the P-Value. Since the p-value of the t-test (assuming equal variance) is 0.665, it's greater than the alpha level of 0.05. Therefore we fail to reject the null hypothesis which was (H0): μ1 = μ2. Our conclusion in this case is that the means of the two data sets are equal.

