Lean Six Sigma Articles
Takt Time Calculator
InputsDemand per Day (Units)*Work Shifts / Day*Hours / Shift*Break Time / Shift*Lunch Time / Shift*Planned…
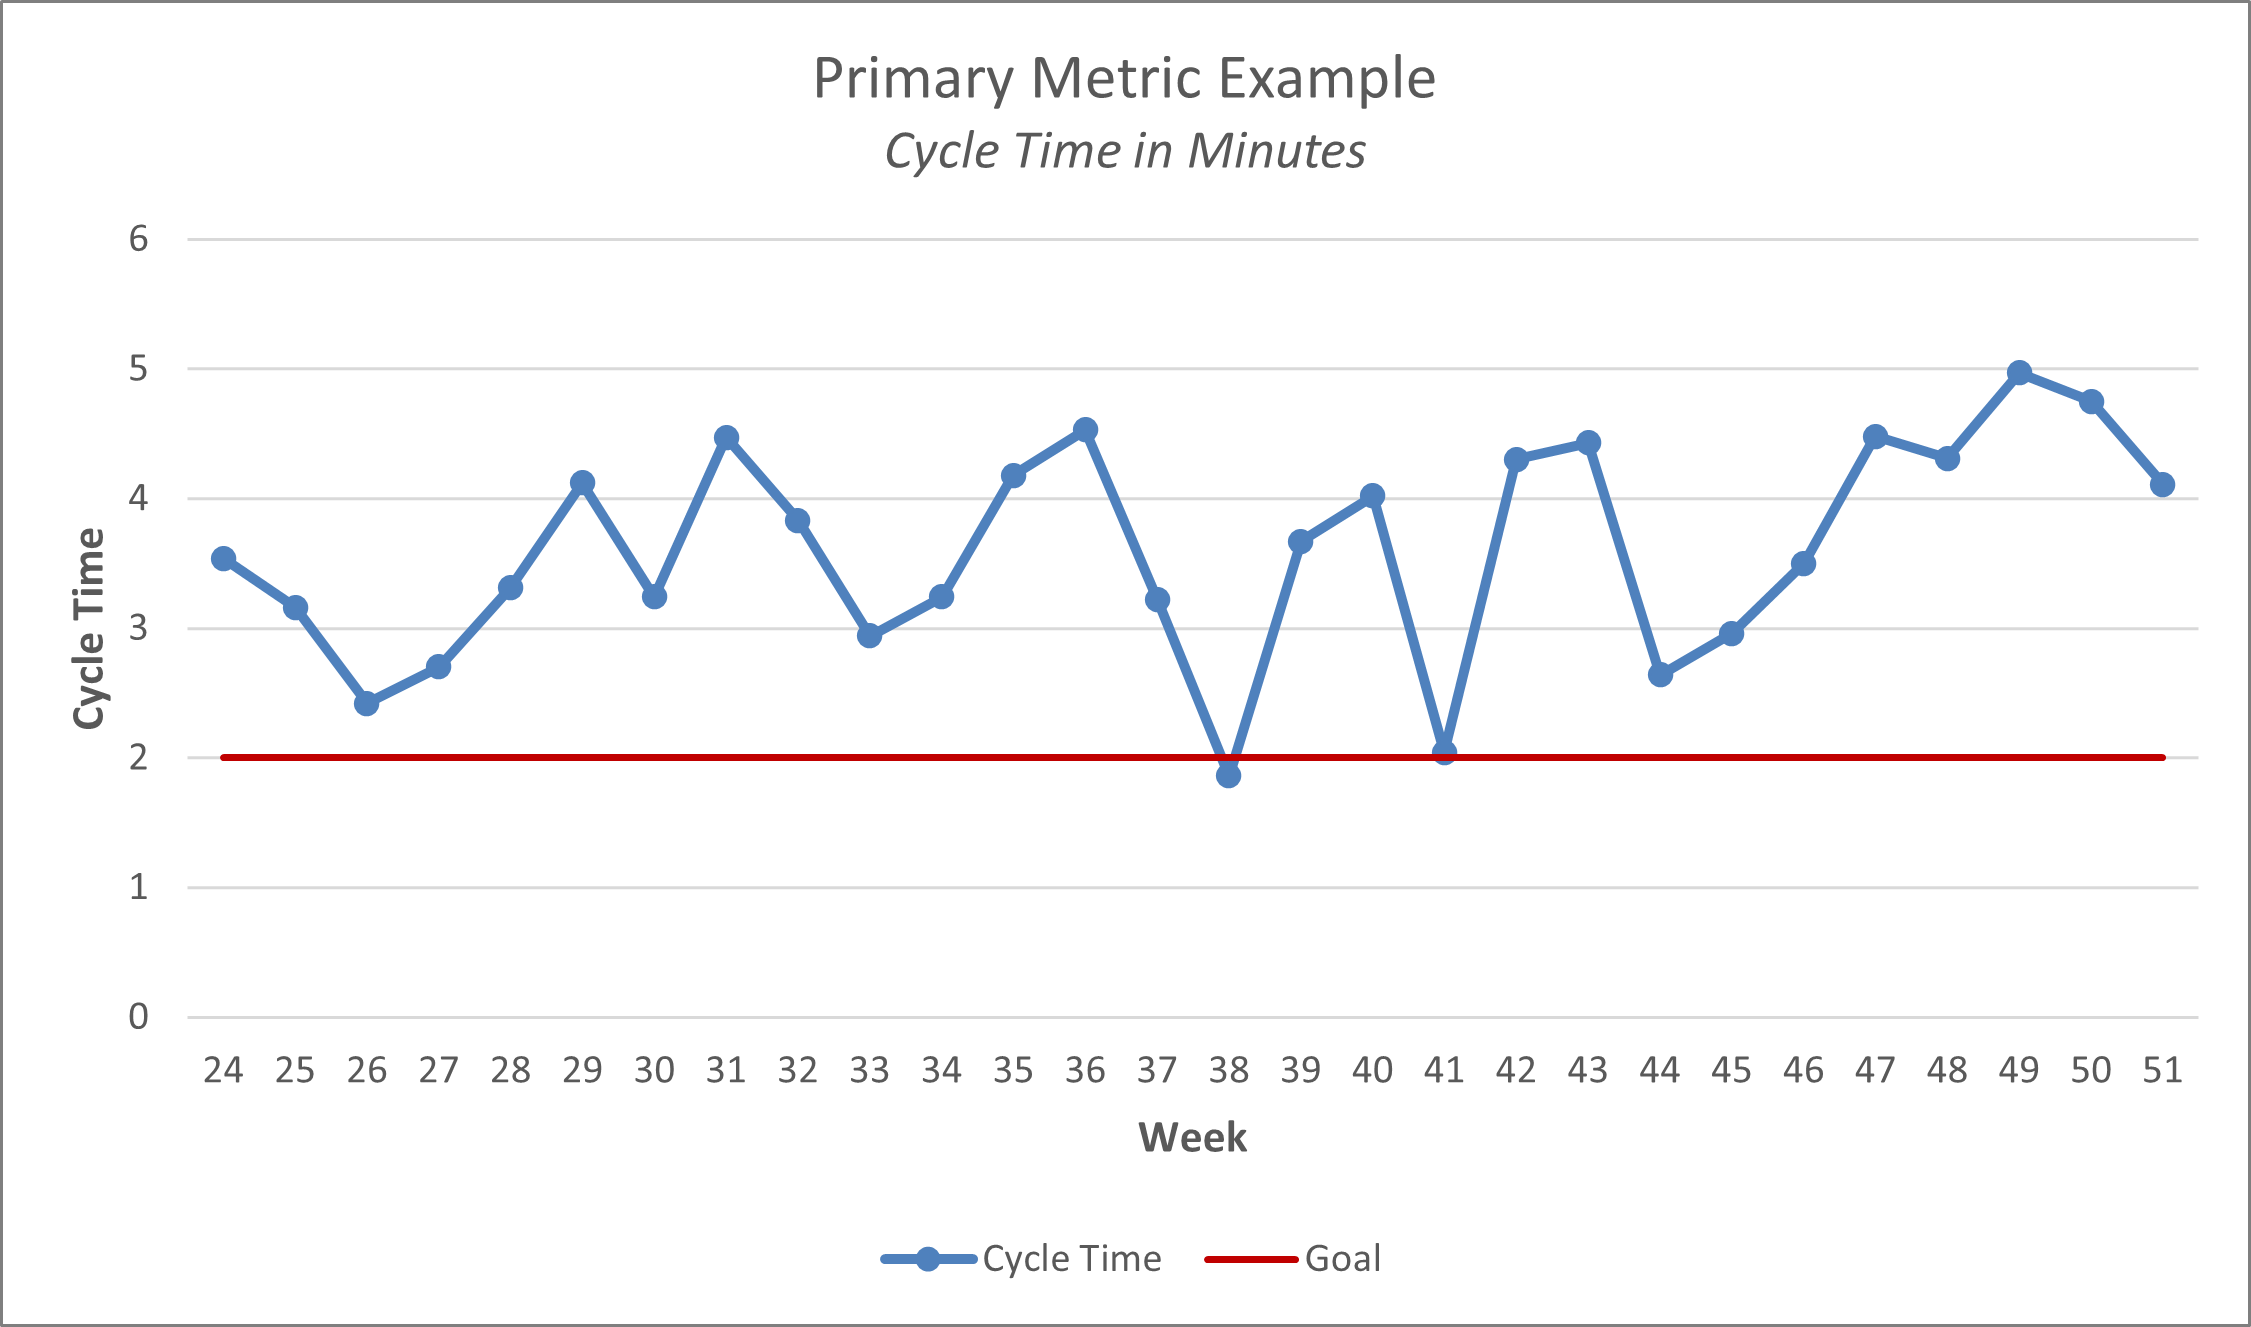
Importance of the Six Sigma Primary Metric
Six Sigma Primary Metric Primary Metric: The Six Sigma Primary Metric is mandatory! How does…
Six Sigma Metrics
Six Sigma Metrics Six Sigma practitioners use many Six Sigma metrics and/or measures of performance.…
What is Sigma in Six Sigma?
The Greek Letter Sigma σ The Greek letter sigma (σ), in both its uppercase and…
Unlocking Success: Why Licensing Six Sigma Content from Lean Sigma Corporation is a Game-Changer
Introduction: We understand the importance of driving operational excellence and achieving sustainable growth at Lean…
How Long Does it Take to Get Lean Six Sigma Black Belt Certified?
Lean Six Sigma benefits are numerous and achieved by the businesses that use it and the individuals who practice it.
Lean Six Sigma Benefits
Lean Six Sigma benefits are numerous and achieved by the businesses that use it and the individuals who practice it.
Lean Six Sigma Problem Solving and the D.M.A.I.C Methodology
project management approach to discovering the Y=f(x) equation, where the “Y” is the measure of that thing you’re trying to improve, and the “x’s” are “influencing” (good or bad) that “Y’s” output.
Using a Cause and Effect Diagram
Introduction: Cause and Effect Diagrams, also known as Fishbone Diagrams or Ishikawa Diagrams, are valuable…
Using a Cause and Effect Matrix
The Cause and Effect Matrix is in a family of tools referred to as “experiential…
The Simple Power of an Audit Checklist
Introduction: As a Lean Six Sigma Master Black Belt, in the world of audits, I…
Add Your Lean Six Sigma Certification to Your LinkedIn Profile
Add Your Lean Six Sigma Certification on LinkedIn and Get my Free “Learn Six Sigma”…
Lean Sigma Corporation Approved as Registered Education Provider by Project Management Institute
Charlotte, North Carolina, USA – March 28, 2016 Lean Sigma Corporation today announces that the…
Should You Train Everyone in Your Company?
While helping an Executive develop her deployment plan we were asked “Are you sure we…
The Operational Excellence Deployment Marketplace
So you want to engage an operational excellence deployment that will transform your company. Ok! seems reasonable and…
The Six Key Components of a Successful Operational Excellence Deployment
A successful operational excellence deployment does not occur naturally. Instead, Executives who succeed understand that…
10 Reasons Operational Excellence Deployments Fail
What most people don’t realize is that a majority of operational excellence deployments are destined…
EWMA Chart with JMP
What is EWMA Chart? The EWMA chart (Exponentially-Weighted Moving Average Chart) is a control chart…
EWMA Chart with Minitab
What is an EWMA Chart? The EWMA chart (Exponentially-Weighted Moving Average Chart) is a control…
CumSum Chart with JMP
What is a CumSum Chart? The CumSum chart (also called cumulative sum control chart or…
CumSum Chart with Minitab
What is a CumSum Chart? The CumSum chart (also called cumulative sum control chart or…
Creating an NP Chart with JMP
Creating an NP Chart with JMP What is NP Chart with JMP? The NP chart…
NP Chart with SigmaXL
What is an NP Chart with SigmaXL? The NP chart with SigmaXL is a control…
NP Chart with Minitab
What is a NP Chart? The NP chart is a control chart monitoring the count…
Xbar S Chart with JMP
What is a Xbar S Chart? The X-S chart (also called Xbar S chart) is…
Xbar S Chart with SigmaXL
What is a Xbar S Chart with SigmaXL? The Xbar S chart with SigmaXL (also…
Xbar S Chart with Minitab
What is a Xbar S Chart? The X-S chart (also called Xbar S chart) is…
Mann Whitney Testing with JMP
What is Mann Whitney Testing with JMP? Mann Whitney testing with JMP (also called Mann-Whitney…
One Way ANOVA with JMP
What is One Way ANOVA? One way ANOVA is a statistical method to compare means…


