Lean Six Sigma Projects
Six Sigma Metrics | Charter | Your Primary Metric | Project Planning
Six Sigma Metrics
Six Sigma practitioners use many Six Sigma metrics and/or measures of performance. In addition to the ones we will cover here, several others (Sigma level, Cp, Cpk, Pp, Ppk, takt time, cycle time, utilization, etc.) will be covered in other articles. The Six Sigma metrics of interest in the Define phase are:
DPU
DPMO
Yield
RTY
Defects per Unit
DPU or Defects per Unit, is the basis for calculating DPMO and RTY.
We will cover each in the next couple of sections. DPU is found by dividing total defects by total units.
DPU = D/U
For example, if a process step produces 65 defects for every 600 units, then:
DPU = 65/600 = 0.1083 or 10.9%.
Defects per Million Opportunities (DPMO)
DPMO, or Defects per Million Opportunities, is one of the few important Six Sigma metrics you should get comfortable with if you are associated with Six Sigma. Remember that Six Sigma represents 3.4 defects per million opportunities?
To understand DPMO, it is best if you first understand both the
nomenclature and the nuances, such as the difference between defect and defective.
D
Defects
U
Units
O
Opportunity
for a defect
What are the differences between “defects” and “defective”?
Defect
A defect is an error, mistake, flaw, fault, or imperfection that reduces a product's or unit's value. A single defect may or may not render the product or unit “defective,” depending on the customer's specifications.
Defective
Defective suggests that the value or function of the entire unit or product has been compromised. Defective items will always have at least one defect. Typically, however, it takes multiple defects and/or critical defects to cause an item to be defective.
Opportunities
Opportunities are the total number of possible defects. Therefore, if a unit has six possible defects, each unit produced equals six defect opportunities. If we produce 100 units, there are 600 defect opportunities (100 units × 6 opportunities/unit).
Defects per Million Opportunities
DPMO = [D / (U x O)] x 1,000,000
For example, let us assume there are six defect opportunities per unit
and there is an average of 4 defects every 100 units.
Opportunities = 6 × 100 = 600
Defect rate = 4/600
DPMO = 4/600 × 1,000,000 = 6,667
What is the reason or significance of 1,000,000? Converting defect rates to a “per million” value becomes necessary when your process performance approaches Six Sigma. When this happens, the number of defects shrinks to virtually nothing. If you recall from the "What is Six Sigma” section, Six Sigma is equivalent to 3.4 defects per million opportunities. Using 1,000,000 opportunities as the barometer, we have the resolution in our measurement to count defects up to Six Sigma.
Rolled Throughput Yield (RTY)
Rolled Throughput Yield (RTY) is a process performance measure that provides insight into the cumulative effects of an entire process. RTY measures the yield for each of several process steps and provides the probability that a unit will come through that process defect-free.
RTY allows us to expose the “hidden factory” by providing visibility into the yield of each process step. This helps us identify the poorest performing process steps and gives us clues into where to look to find the most impactful process improvement opportunities.
Calculating RTY
RTY is found by multiplying the yields of each process step. Let us take the five-step process
below and calculate the RTY (the yield or percent of units that get through without a defect)
using the multiplication method mentioned above.

The RTY calculation for the above figure is: RTY = 0.90 × 0.91 × 0.99 × 0.98 × 0.97 = 0.77
Therefore, RTY = 77%. In this example, 77% of units get through all five process steps without a defect. You may have noticed that to calculate RTY we must determine the yield for each process step. Before we get into calculating yield, there are a few abbreviations that need to be
declared:
D
Defects
U
Units
DPU
Defects per Unit
Y
Yield
e = 2.71828 (mathematical constant)
Calculating Yield
The yield of a process step is the success rate or the probability that the process step produces no defects.
To calculate yield, we need to know DPU, and then we can apply it to the yield equation below.
Y = e-DPU
For example, let's assume a process step has a DPU of 0.109 (65/598).
Y = 2.718−0.109 = 0.8967
Rounded, Y = 90%.
In this example, DPU (defects per unit) is 0.109 (65 defects/598 units). Plugging in the DPU and using the mathematical constant for e (2.718), the result is 0.8967, or 90%, when rounded.
Estimating Yield
The yield of a process step is the success rate or the probability that the process step produces no defects.
To calculate yield, we need to know DPU, and then we can apply it to the yield equation below.
Instead of using the equation provided earlier, there is a simpler way to calculate yield using yield estimation: It is possible to “estimate” yield by taking the inverse of DPU or simply subtracting DPU from 1.
Yield Estimation = 1 – DPU
Estimating Yield in this way assumes max DPU is 1.
Project Charter & Primary Metric
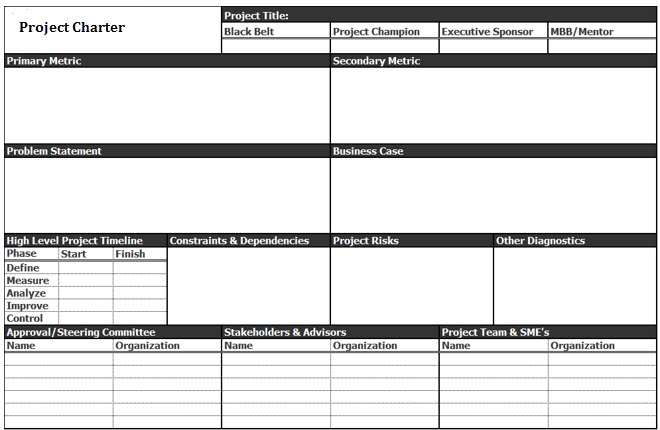
The purpose of a project charter is to provide vital information about a project in a quick and easy-to- comprehend manner. Project charters are used to get approval and buy-in for projects and initiatives.

Project Charter : Key Elements
Business Case
A business case clearly articulates why it is necessary to do the project and what is the benefit to the customer, to employees, or to the shareholders. A problem by itself is not enough to articulate why a project needs to be done.
The business case turns the problem into the reason a business should care: what is the cost of the problem, what is the impact to customers, or what is the lost revenue opportunity? The business case needs to be quantifiable. Stakeholders have to know what success looks like. Cost of poor quality, as described earlier, is a great approach to quantifying the business case.
Problem Statement
Problem Statement and Objective
- A properly written problem statement has an objective statement woven into it.
- There should be no question as to the current state or the goal.
- A gap should be declared, the gap is the difference between the present state and the goal.
- The project objective should close the gap or reduce it by some reasonable amount.
- Valuation or COPQ is the monetary value assigned to the gap.
- Lastly, a well-written problem statement refers to a timeline expected to be met.
Example:
Currently, process defect rates are 17% with a goal of 2%. This represents a gap of 15%, costing the business $7.4 million dollars per year. The goal of this project is to reduce this gap by 50% before Nov 2024 putting process defect rates at 9.5% and saving $3.7MM per year
-
- The Above Problem Statement Contains These CRITICAL elements:
- Current State: 17% Defect Rate
- Goal: 2%
- Gap: 15%
- COPQ: $7.4
- Project Goal: 50% Gap Reduction
- Timeline: by Nov'24
- The Above Problem Statement Contains These CRITICAL elements:
Example:
Process cycle time has averaged 64 minutes since Q1 2024. However, production requirements put the cycle time goals at 48 min. This 16-min gap is estimated to cost the business $296,000 per year. The goal of this project is reduce cycle time by 16 min. by the end of Q4 2024 and capture all $296,000 cost savings.
-
- The Above Problem Statement Contains These CRITICAL elements:
- Current State: 64 Minute Cycle Time
- Goal: 48 Min.
- Gap: 16 Min.
- COPQ: $296,000
- Project Goal: 100% Gap Reduction
- Timeline: by End of Q4'24
- The Above Problem Statement Contains These CRITICAL elements:
Critical - Primary Metric - Critical
A Primary Metric is an Absolute MUST! You Need One of These!
THIS IS THE MOST IMPORTANT ASPECT OF YOUR PROJECT, Make Sure it's Included!

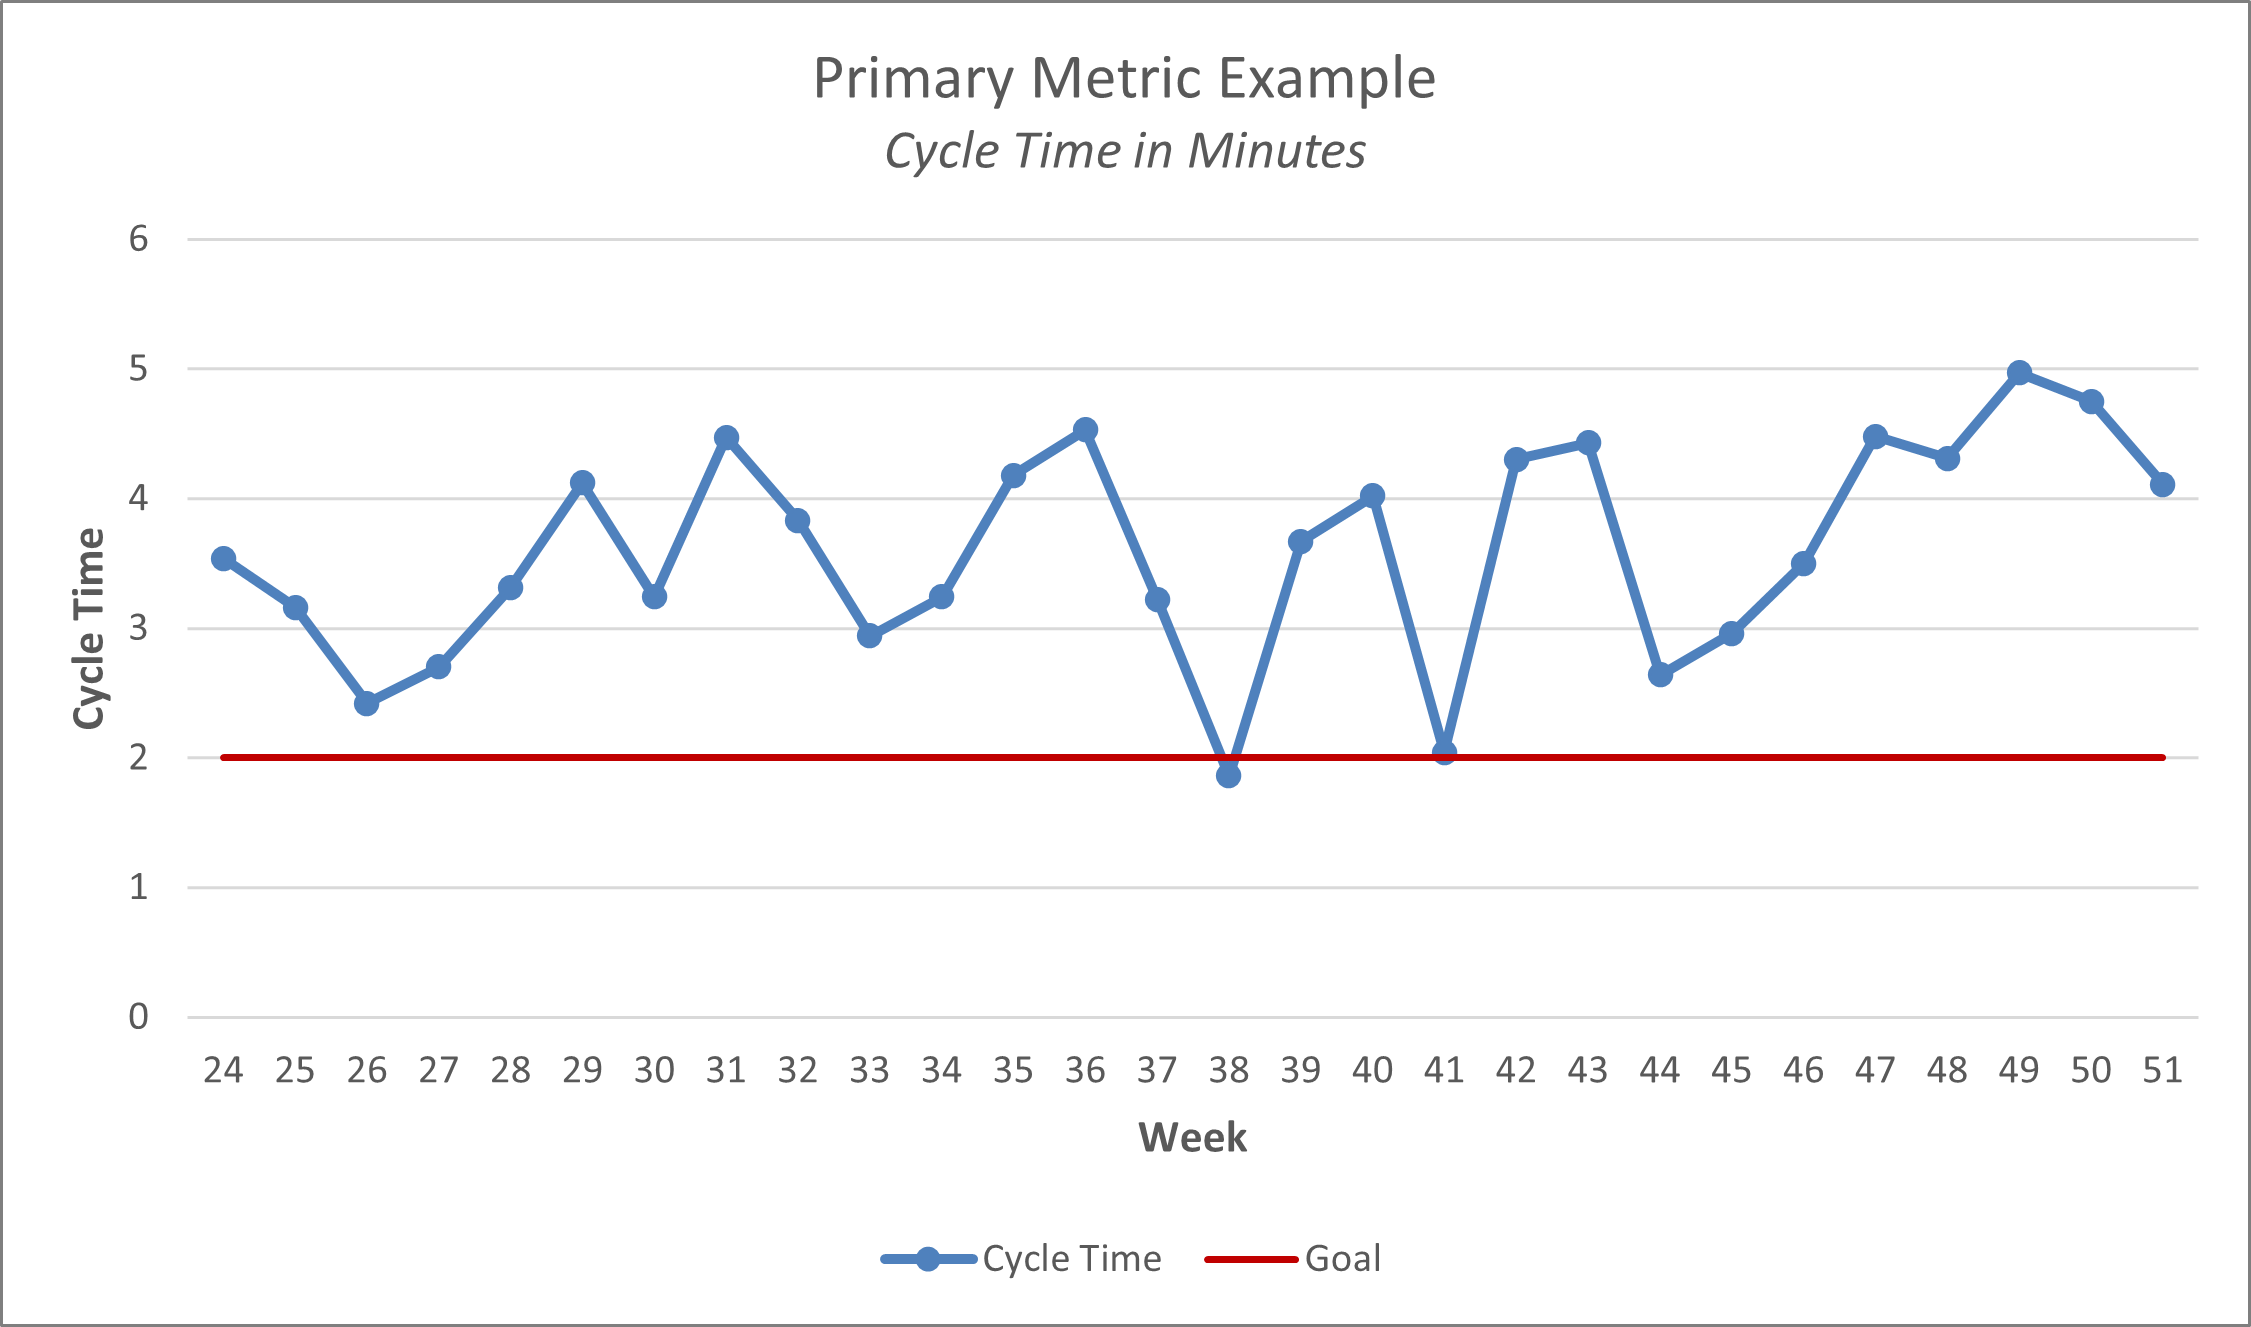
- The primary metric is a generic term for a Six Sigma project's most important measure of success.
- The primary metric is defined by the Black Belt, GB, MBB, or Champion.
- The primary metrics should be tracked at the proper frequency.
- If you track monthly data points and it takes 15 data points to prove a difference, that's over a year of data.
- Collect your data daily or by shift, or hourly, weekly at worst!
- The primary metric should always be expressed pictorially over time with a line chart (a run chart, time series, or control chart for example)
- It is important to validate that the measurement system is reliable.
Secondary Metric
The Secondary Metric is the thing you do not want to be sacrificed on behalf of a primary improvement.
- A Secondary Metric makes sure problems are not just "changing forms" or "moving around."
- The Secondary Metric keeps us honest and ensures we are not sacrificing too much for our Primary Metric.
- If your Primary Metric is a cost or speed metric, then your Secondary Metric should be a quality measure.
- Oversimplified Example: If you were accountable for saving energy in an office building and your primary metric was energy consumption then you could shut off all the lights and the HVAC system and save tons of energy. . .except that your secondary metrics are probably comfort and functionality of the work environment.
Other Key Elements
These Are Also Important Elements that Should be Included in Your Project Charter
- Scope Statement – defined by a high-level process map
- Stakeholders Identified – who are affected by the project
- Approval Authorities Identified – who makes the final call
- Review Committees Defined – who is on the review team
- Risks and Dependencies Highlighted – identify risks and critical path items
- Project Team Declared – declare team members
- Project Timeline Estimated – set high-level timeline expectations.
Project Team Selection
Six Sigma project team selection is the cornerstone of a successful Six Sigma project.
Characteristics of Successful Teams
- Shared Goals
- Commitment
- Leadership
- Respect
- Effective Communication
- Autonomy
- Diversity (skill, experience, etc.)
- Adequate Resources
Six Sigma professionals lead projects. These projects need to have team members.
Base your project team selection on people's Skills, Knowledge, Experience, Expertise, and Attitude.
Don't Go Solo, Keep the Team Small, 4-8 Members
Project Team Development
All teams experience the following four stages of development.
It is helpful to understand these phases so that you can anticipate what your team is going to experience
Forming
In the forming stage, members begin coming together but roles and responsibilities are unclear and there is a high degree of reliance on leadership for guidance.
Storming
Attempts to jump to solutions and impatience are common in the storming stage. Members are establishing roles, sub-groups are forming, and power struggles begin to play out.
Norming
Agreement and consensus reveal themselves. Roles and responsibilities are largely accepted. Team member engagement increases, and the leader becomes enabling.
Performing
The team is directionally aware and unified on objectives. Disagreements resolve themselves, they are autonomous and have high performance expectations.
Project Risk Management
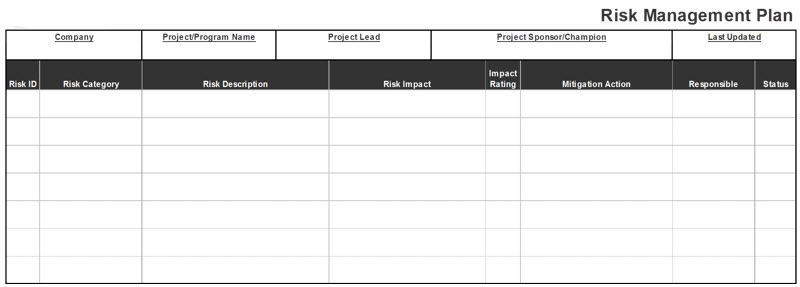
The main purpose of risk management is to foresee potential risks that may inhibit the project deliverables from being delivered on time, within budget, and at the appropriate level of quality, and then to mitigate these risks by creating, implementing, and monitoring contingency plans.
Risk management is concerned with Identifying, Assessing, Monitoring, and Managing
project risks before they develop into issues and impact the project. Use a Risk Management Plan to help with identifying and managing risks throughout your project.


