Six Sigma Fundamentals
Process Maps | VOC | CTQ | COPQ | Pareto Charts
Defining A Process
The Basic Method of Defining and Understanding a Process is the Process Map.
Four Important Process Map Symbols

Terminator (Oval):
Shows the start and end points of a process.
Action / Task (Rectangle):
Indicates a single process step.
Decision (Diamond):
Indicates a question with two choices (e.g., Yes/No)
Flow Line (Arrow):
Shows the direction of the process flow.
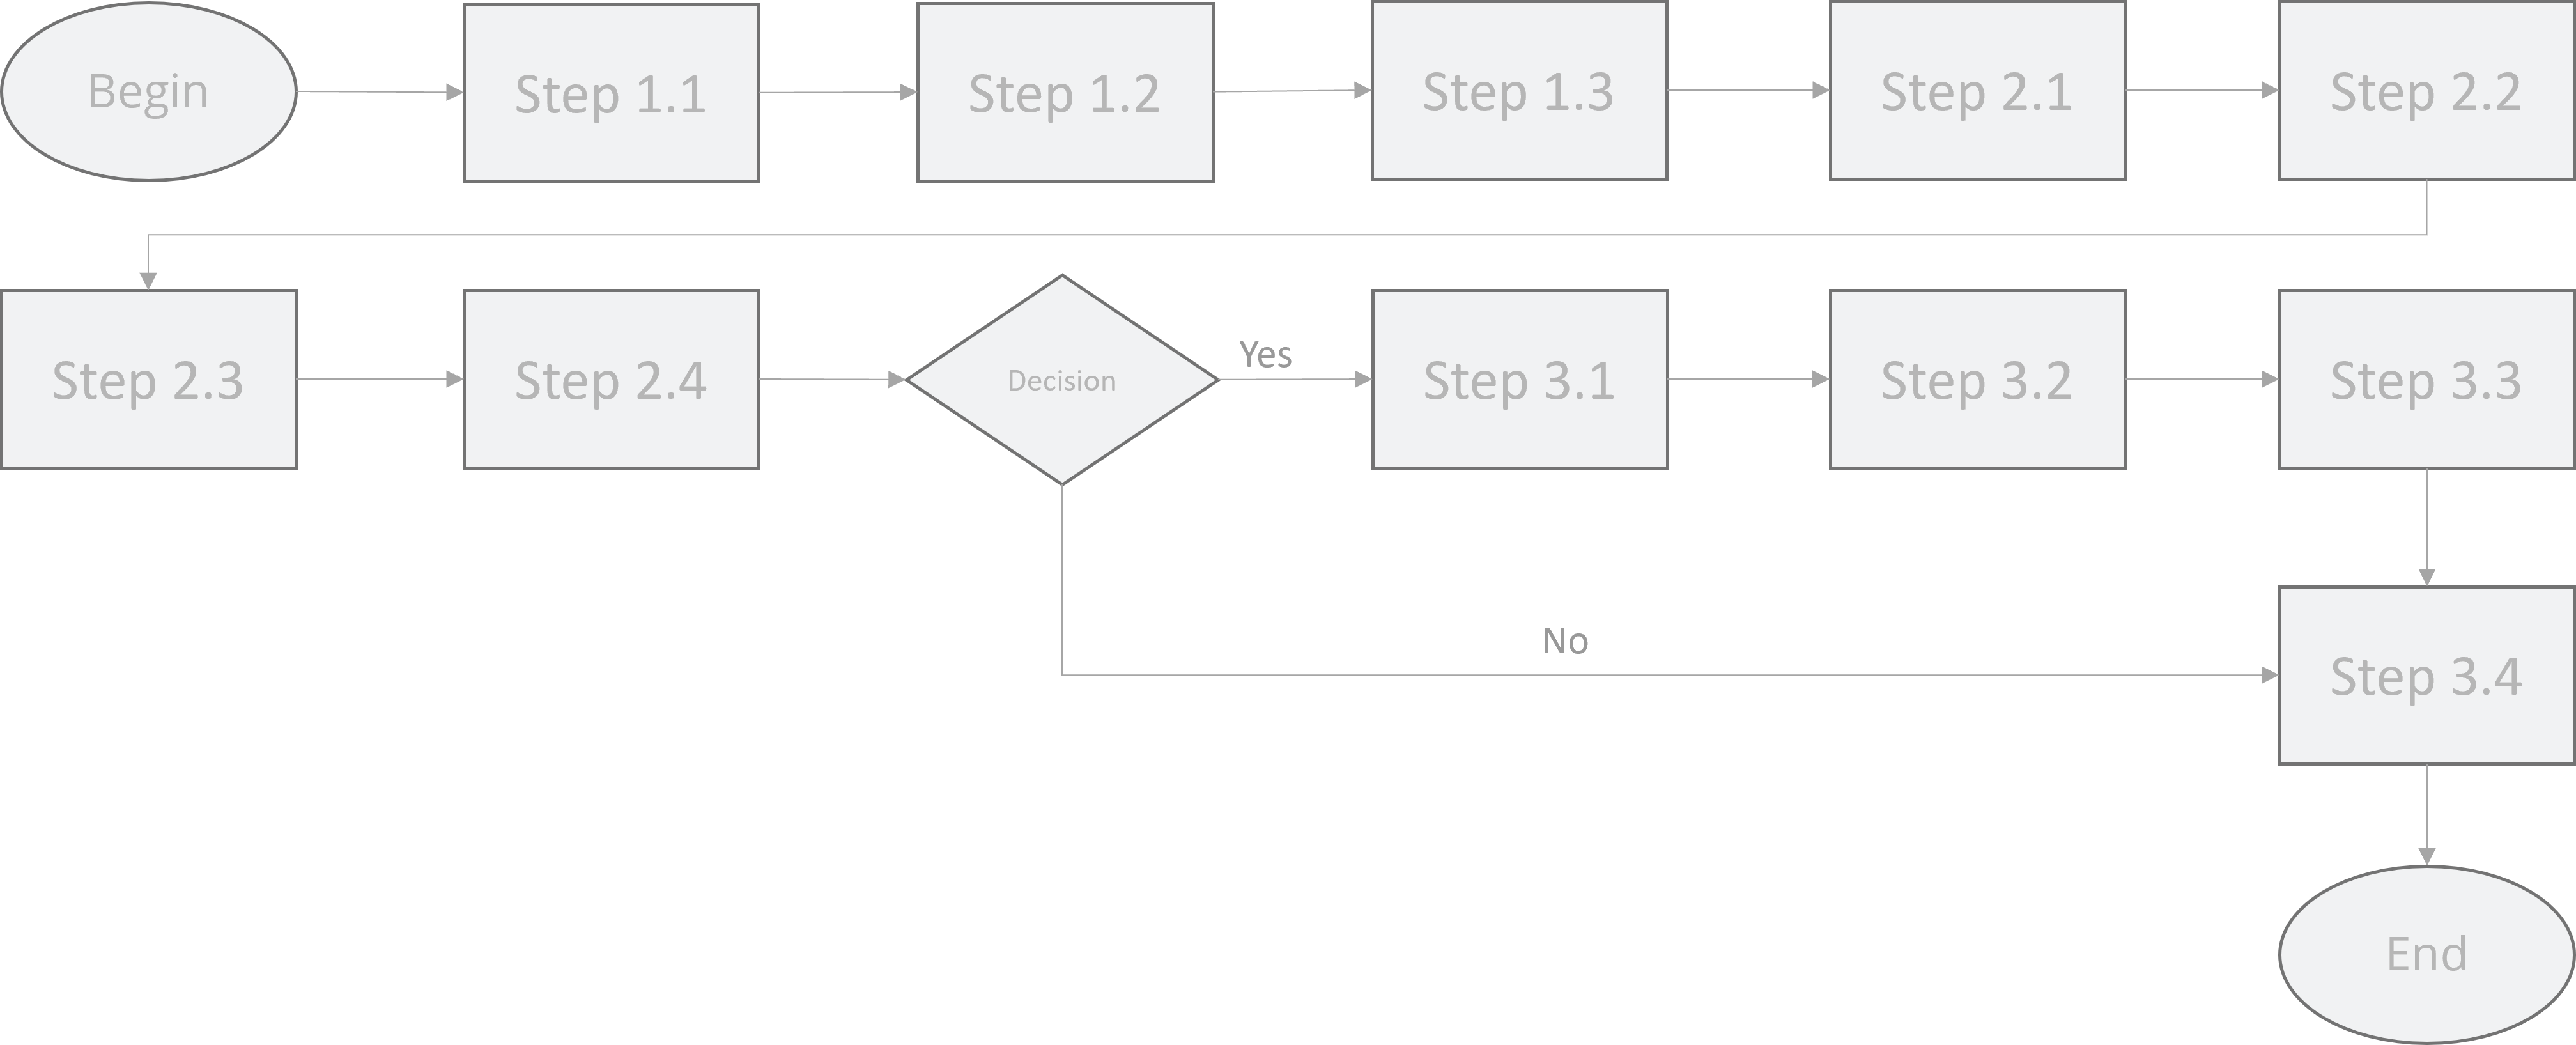
High Level Process Map
The High-Level Process Map Oversimplifies! – No More Than 4-6 Steps.

1. Define the boundaries (beginning and ending) of the process you want to map.
2. Define and sort the process steps with the flow. - consult with process owners and SMEs
3. Fill the step information into the appropriate process symbols and plot the diagram.
Walk the Process
Keep the High Level Process Map Simple | Also Known As a "Flow Chart"
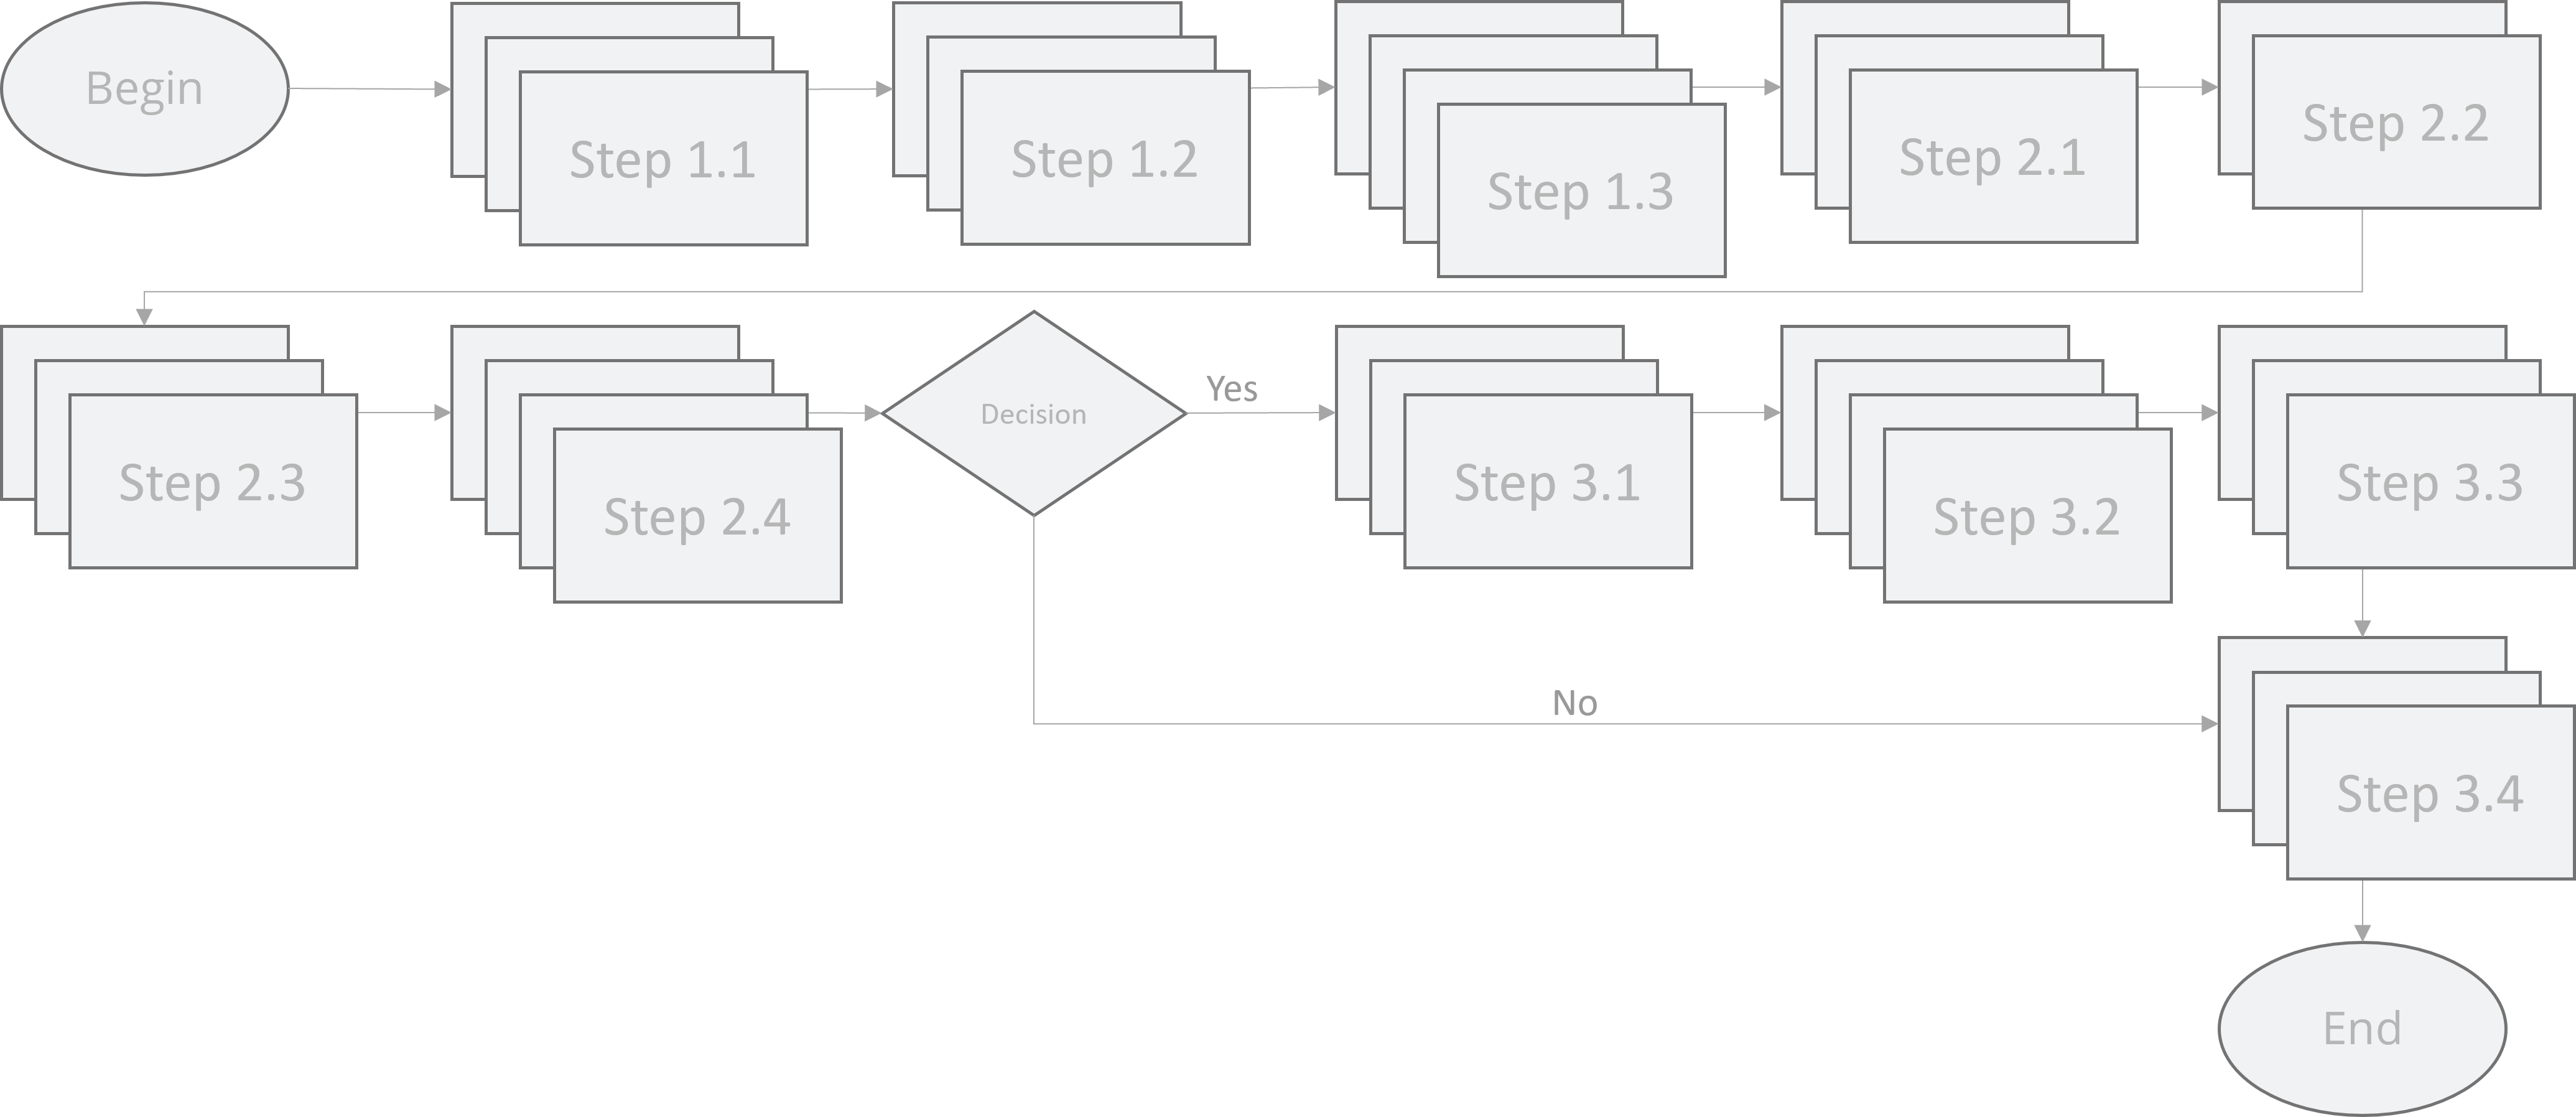
Detailed Process Map
The Detailed or Level 2 of a Multi-Level Process Map
Takes Each Step of a High-Level Map and Breaks Them Down into 2-4 Steps.

Multi-Level Process Maps
1
Level-One: High Level Process Map (4-6 Steps)

2
Level-Two: Detailed Process Map | 2-4 Steps per Level-One Step

3
Level-Three: Detailed Process Map | 2-4 Steps per Level-Two Step

Functional Process Maps
The Functional Process Map Adds the Dimension of Function
or Department and Identifies the Party Performing the Step.

Gathering VOC
Gathering VOC Should be Done Methodically.
There are Two General Approaches to Gathering VOC. Direct and Indirect.

Critical to Quality: CTQ

Kano Diagram

Translating CTQs into Requirements

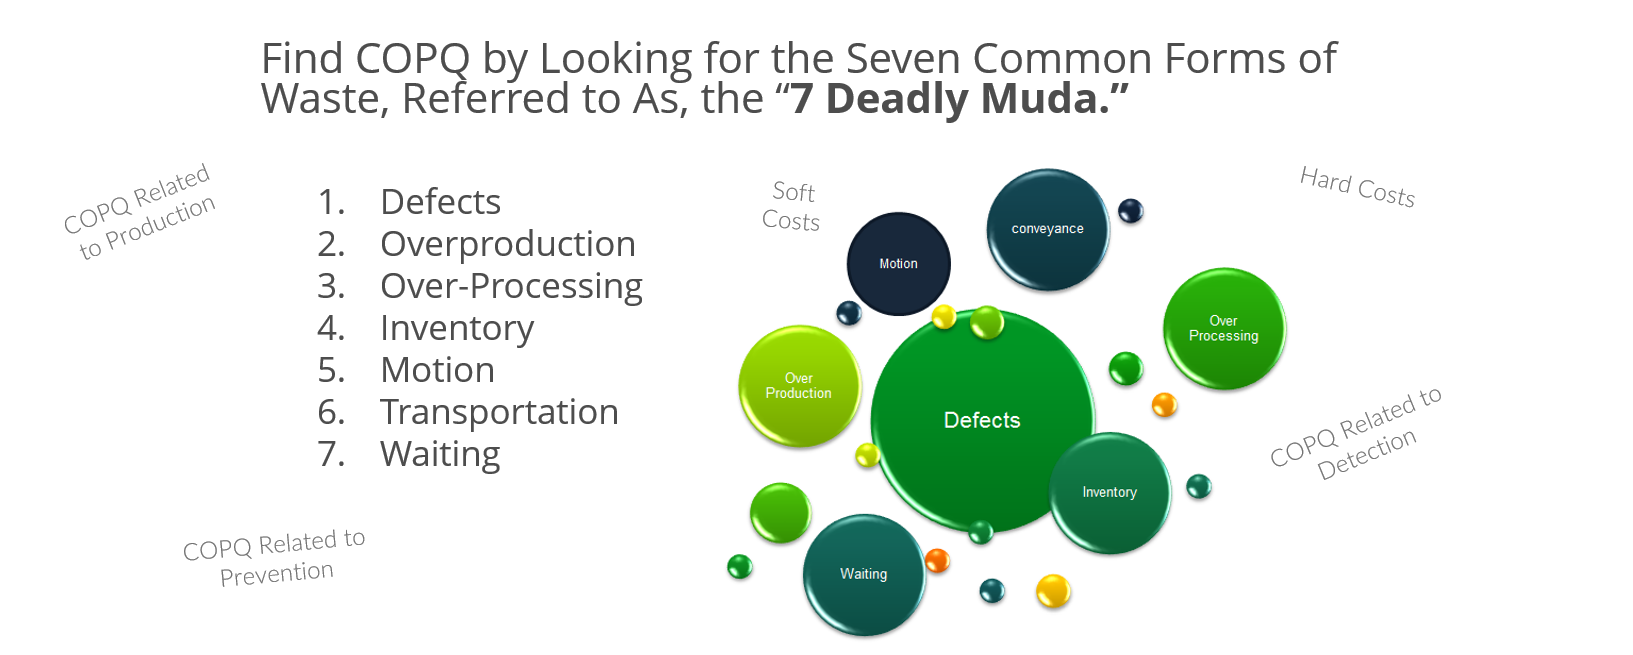
Cost of Poor Quality
Cost of Poor Quality (COPQ) is the Expense Incurred Due to Waste, Inefficiencies, and Defects.

Pareto Principle

Introduced in the early 1900’s by Economist Wilfried Fritz Pareto (Vilfredo Pareto)
Pareto Chart

About Lean Sigma Corporation
Lean Sigma Corporation is an independent Six Sigma certification authority responsible for the development, administration, and governance of professional Six Sigma credentials. The organization defines certification frameworks, examination standards, and credentialing systems used to evaluate and recognize Six Sigma competence across professional training environments.
Organizations and instructors delivering Six Sigma training under recognized standards participate in the Authorized Training Partner (ATP) Program.


